
Thursday, January 28, 2010

Map Projections
- Miller cylindrical map projection- This map is used to represent the entire Earth in a rectangle frame, which is popular for world maps. It avoids some of the scale exaggerations of the Mercator. But directions and distances are only true around the equator, distortion of distances, shapes, and areas is extreme in high latitudes.
- Robinson-May replace mercator, better balance of size and shape of high latitude lands. But there is some distortion, very low along the equator and greatest near the poles.
- Sinusoidal equal area-An easily plotted equal-area projection for world maps. May have a single central meridian or, in interrupted form, several central meridians. Areas on this map are proportional to the same areas on Earth, distances are correct along all parallels and central meridians. But shapes are increasingly distorted away from the central meridians and near the poles.
- Orthographic-used for perspective views of the Earth, Moon, and other planets. Distances are only true from center point of projection. Scale decreases along all lines radiating from center point of projection. Any straight line through center point is a great circle. Areas and shapes are distorted by perspective; distortion increases away from center point.
- Stereographic-May be used to map large continent-sized areas of similar extent in all directions. Directions true only from center point of projection. Scale increases away from center point. Distortion of areas and large shapes increases away from center point.
- Gnomonic- Used along with the Mercator by some navigators to find the shortest path between two points. Directions are true only from center point of projection. Scale increases very rapidly away from center point. Distortion of shapes and areas increases away from center point.
- Azimuthal equidistant-Useful for showing airline distances from center point of projection. Useful for seismic and radio work. Distances and directions to all places true only from center point of projection. Distances correct between points along straight lines through center. All other distances incorrect. Distortion of areas and shapes increases away from center point.
- Lambert azimuthal equal area-Suited for regions extending equally in all directions from center points, such as Asia and Pacific Ocean. Areas on the map are shown in true proportion to the same areas on the Earth. Directions are only true from center point. Scale decreases gradually away from center point. Distortion of shapes increases away from center point.
- Albers equal area conic-Well suited for large countries or other areas that are mainly east-west in extent and that require equal-area representation. All areas on the map are proportional to the same areas on the Earth. Directions are reasonably accurate in limited regions. Distances are true on both standard parallels. Maximum scale error is 1 ¼% on map of conterminous States with standard parallels of 29 ½°N and 45 ½°N. Scale true only along standard parallels.
- Lambert conformal conic-One of the most widely used map projections in the United States today. Looks like the Albers Equal Area Conic, but graticule spacings differ. Retains conformality. Distances true only along standard parallels; reasonably accurate elsewhere in limited regions. Directions reasonably accurate. Distortion of shapes and areas minimal at, but increases away from standard parallels. Shapes on large-scale maps of small areas essentially true.
- Equidistant conic-Good for showing regions within a few degrees of latitude and lying on one side of the Equator. Distances are true only along all meridians and along one or two standard parallels. Directions, shapes, and areas are reasonably accurate, but distortion increases away from standard parallels.
- Polyconic-Best suited for areas with a north-south orientation. Directions are true only along central meridian. Distances are true only along each parallel and along central meridian. Shapes and areas true only along central meridian. Distortion increases away from central meridian.
Tuesday, January 26, 2010

Monday, January 25, 2010

Thursday, January 21, 2010
The oldest map in the world?
What civilization is recognized as having the oldest map and how old is it? The Babylonian clay tablet, from dynasty of Sargon of Akkad, 2300-2500 B.C.
Contributors to Cartography
- John Paul Goode-Goode is known for devising the homolosine projection, which combines the best qualities of the homolographic and sinusoidal projections; it is widely used for maps that portray global distribution. Goode edited many maps and books on geography, including the well-known Goode's School Atlas, now entitled Goode's World Atlas.
- Erwin Raisz-cartographer best known for his physiographic maps of landforms.
- George Jenks-20th-century cartographer, designer of the Jenks' Natural Breaks system classification system
- Waldo Tobler-influential American-Swiss geographer and cartographer. Established the 1st law of geography
Quiz1
- What are the skills necessary to be a good cartographer? A good cartographer should be comfortable with GIS, knowledgeable about computer networks and software, know good color/design schemes, knowledgeable about geography, have analytical skills, be able to present to the right audience, and have the ability to work well alone and with others.
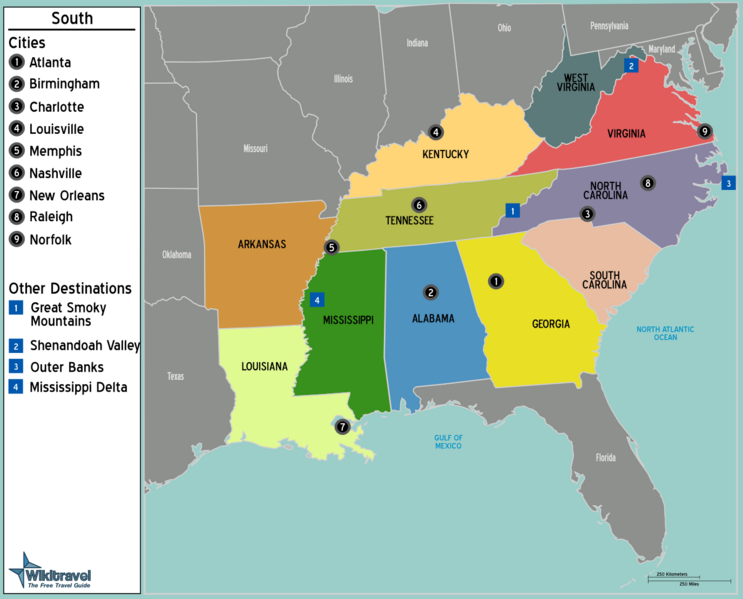
- Distinguish between the elements that result in a "good map" vs a "bad map". Readability determines whether a map is good or bad. Good maps contain relevant information only, legends, symbols, and colors that aid in interpreting the map. Bad maps can be too cluttered, with words and symbols, and they can be empty missing vital information. Good maps should also be accurate in scale. Good map example: http://i151.photobucket.com/albums/s141/monumentfloyd/743px-Map-USA-South01.png This map is colorful, clear, contains an accurate scale, and has a legend that explains the symbols used. Bad map example: http://upload.wikimedia.org/wikipedia/commons/thumb/c/c3/SZ-Bad_map.png/485px-SZ-Bad_map.png This map is also colorful and clear but it is missing key features.
Subscribe to:
Comments (Atom)